Showing posts with label TED. Show all posts

Wednesday, August 24, 2011

Infographics! information consolidation superheroes to the rescue!

   So remember when you were in grade school (British translation: primary school) and your teachers kept emphasizing how important it was to be able to read charts and graphs?... no? Well in my early education they certainly did. Over and over again we were asked relatively simple questions about graphs and charts. Rabid math and science teachers tried to convince me and my young gum-chewing, nose-picking peers of their value. "Look!" they said, drooling, "see how amazing it is that you can display lots of information in simple visual way?!". My fellow classmates and I would stare at them in unamused silence. Years later, I left school vowing never to be involved in a profession that relied heavily on math and promptly forgot my teachers well-intentioned words of wisdom. Until now!

   Whether or not you study information science, it's clear to see that information is what controls our current lifestyle. Never before have we had access to some much at our fingertips. As I and countless others have mentioned before, information overload is an inevitable result of this boon. People want well organized information and as much of it as possible. Consolidation and Organization are in! Behold a world of databases, social tagging, and twitter! As much information, as organized and as easy to understand as possible!..thus the INFOGRAPHIC!
The infographic allow us to tame the dissonant information chaos around us and make POINT without shouting! . . . (imagine that)
But don't take my word for it. Let's listen to an expert...


Let me interrupt all this excitement with one quick caveat...As David McCandless mentioned whoever can manipulate the most information controls everything. So be a good little journalist and be sure to check the credibility of your sources.
(Corn Refiners Association & America's Natural Gas Alliance...I mean you!) 
case & point
Anyway, on the more happy stuff! So what does all this hubbub about infographics mean to a Web 2.0, interactive, semantic web, techie-buzzword world!? As you saw in the first video, infographics can become interactive...check out the example below for something that takes this to another level:


So want to design some infographics of your own?

  • Check out this article this article about 10 of the best free inforgraphic tools. 
  •  Lucidchart. It is not as dynamic as some of the other tools, but it still allows you to easily create flowcharts quickly, easily, and socially. Plus I am a sucker for the "Hey Jude" flow chart video.
  • Prezi - those in cdp23 know it well...yes i know its more of a presentation tool but you can create infographics within it

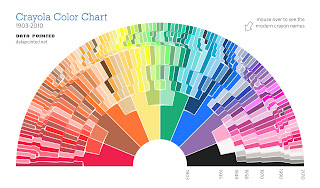
    Infographics Just for fun:


    click the pic for an enlarged view


    Also check out
    Cool Inforgraphics.coman awesome blog that posts interesting inforgraphics from all over the web


    Tuesday, June 28, 2011

    Something to Think About

    One of the people gracious enough to comment on posted a link to the Capital District Library Council. The CDLC ran a program similar to the 23 Things Program  I'm participating in the summer...very cool.

    Anyway Pollyalida (my kind commenter) posted this video on her blog as part of the CDLC's program. It's only about 5 minutes and very interesting.


    While the video has some thought provoking "Big Brother" implications, it made me wonder what else could be done in this situation. Yes, Google and other sites are "customizing" the Internet to fit us as users. BUT as the pool of information increases exponentially...What other methods can we use to sift through it??

    Let me know your thoughts...


    ***also if you are new to TED I recommend looking them up and watching/listening to some other talks..very interesting :) ***